Overview
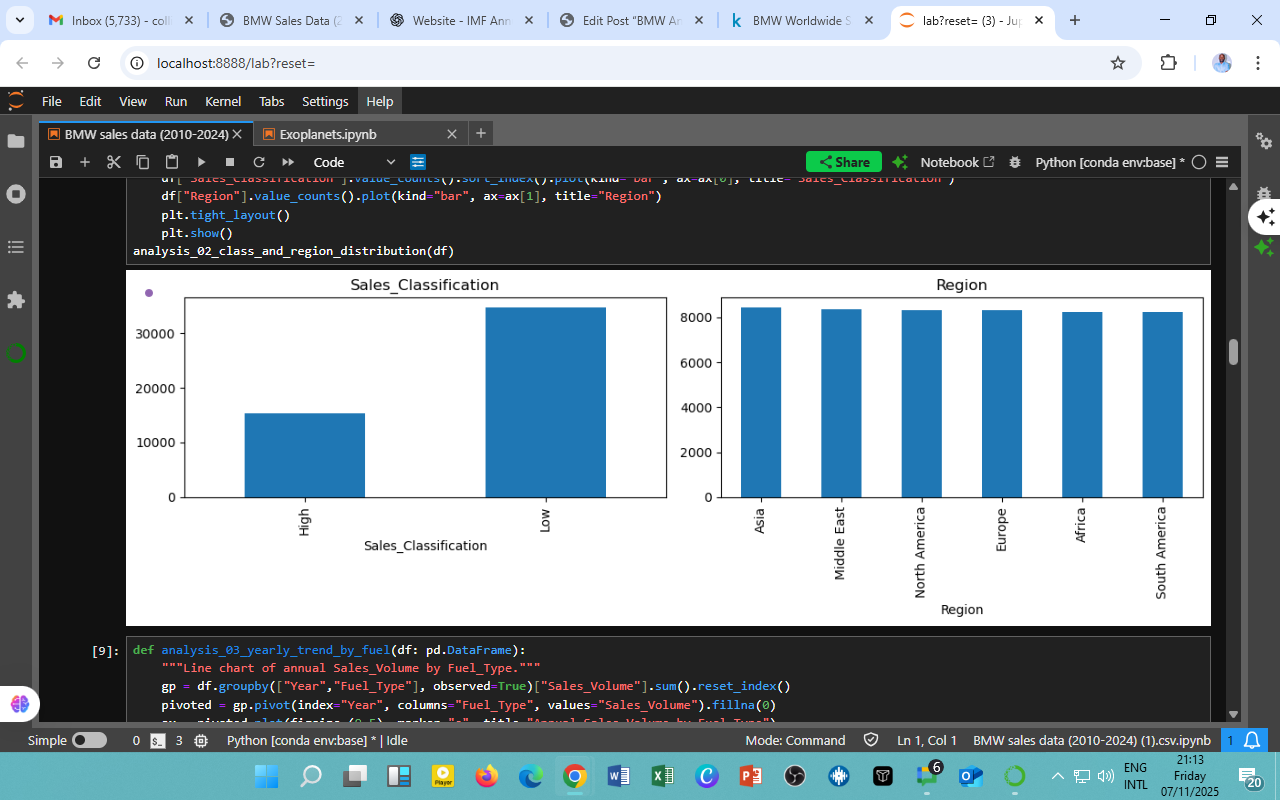
This section explores how BMW’s global sales performance varies across regions and sales categories (classified as High or Low). It provides a broader understanding of where BMW’s strongest markets lie and how sales distribution patterns reflect the company’s worldwide strategy.
Key Observations
1. Sales Classification
-
The “Low” classification category dominates, accounting for nearly twice the volume of “High” sales.
-
This may reflect the price segmentation strategy where mid-range BMW models (Series 1, 2, and 3) generate the largest volume, while high-end models (Series 7, X7, i8, M-series) sell fewer units but contribute significantly to revenue and brand prestige.
-
The sales structure shows market efficiency, a large base of affordable premium vehicles sustaining brand visibility and profitability across multiple segments.
2. Regional Distribution
-
Sales are well distributed across Asia, Europe, North America, Africa, the Middle East, and South America, each showing strong representation of around 8,000–9,000 units.
-
Asia and Europe emerge as consistent leaders, reflecting BMW’s production and demand centers.
-
Africa and South America, though smaller markets historically, now show steady growth — signaling BMW’s expansion in emerging economies where premium vehicle ownership is rising.
-
The uniformity across regions indicates BMW’s success in global diversification, protecting it from region-specific economic shocks.
Analytical Insights
-
Balanced Global Presence: BMW’s even regional distribution demonstrates resilience to economic downturns in any single market.
-
Market Segmentation Strategy: The high-low sales ratio confirms BMW’s commitment to sustaining both volume-based and luxury-margin business models simultaneously.
-
Emerging Markets Growth: Increased activity in Africa and South America aligns with BMW’s 2030 strategy of targeting growing middle-class markets.
-
Policy Implication: Policymakers in developing economies can leverage such data to attract sustainable automotive investments, supporting local assembly and green transition initiatives.
Acknowledgments
-
Data Source: BMW Sales Data (2010–2024), analyzed using the DatalytIQs Academy Analytics Framework.
-
Tools Used: Python (pandas, matplotlib) — categorical grouping and visualization.
-
Contributors:
-
Collins Odhiambo Owino — Lead Analyst & Author, DatalytIQs Academy
-
Kaggle Open Automotive Datasets — Data reference and structure support
-
BMW Group Regional Reports — Contextual reference for global operations
-
Author’s Note
Written by Collins Odhiambo Owino
Founder & Lead Researcher, DatalytIQs Academy
Empowering learners and professionals in Mathematics, Economics, and Finance through data-driven insights.
Leave a Reply
You must be logged in to post a comment.