Blog

  • Global Economic Risks: Tariffs, Policy Shocks, and Uncertainty

    Global Economic Risks: Tariffs, Policy Shocks, and Uncertainty

    By Collins Odhiambo Owino
    Author | DatalytIQs Academy
    Source: IMF World Economic Outlook (October 2025)

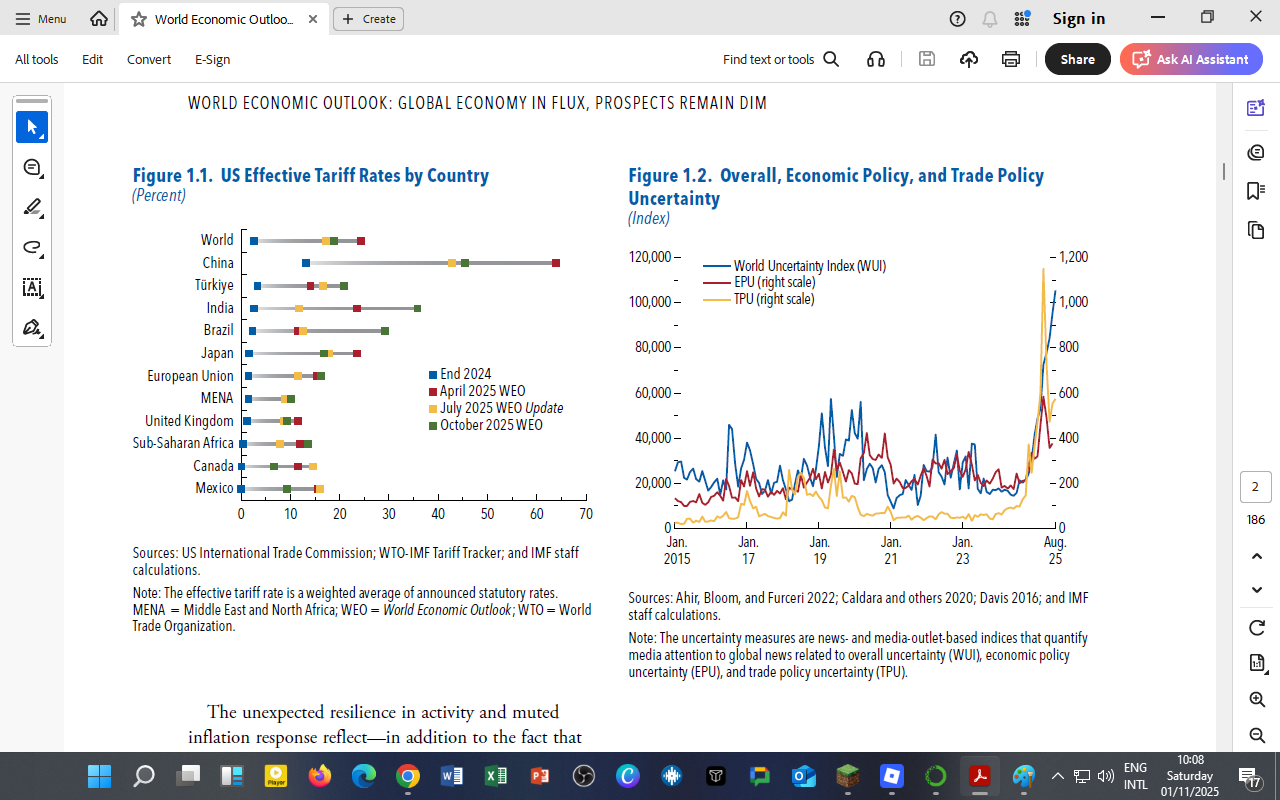
    Figure 1 – Trade Barriers and Global Tensions

    US Effective Tariff Rates by Country:

    • Tariff levels have risen across nearly all major trading partners between end-2024 and October 2025, with the world average exceeding 25%.

    • China faces the steepest increase — tariff rates jumping to nearly 60–65%, reversing years of liberalization.

    • Emerging markets such as India and Brazil also see moderate hikes, reflecting protectionist spillovers.

    • For Sub-Saharan Africa, average tariffs remain below 15%, but indirect effects (through higher import prices for machinery and inputs) are significant.

    Interpretation:
    Rising tariffs constrain global value chains, reduce investment confidence, and contribute to slower global trade volumes — directly explaining the IMF’s downward revision of global growth to 3.2% (2025) and 3.1% (2026).

    Figure 2 – Policy Uncertainty and Economic Volatility

    The chart tracks three indices:

    • WUI (World Uncertainty Index) – measures overall global uncertainty.

    • EPU (Economic Policy Uncertainty) – reflects media-based mentions of fiscal or monetary uncertainty.

    • TPU (Trade Policy Uncertainty) – quantifies trade-related policy risks.

    By August 2025, all three indices spike sharply:

    • The WUI surpasses 100,000 points — the highest since 2020.

    • The TPU soars above 1,000 on its index scale, highlighting renewed anxiety about cross-border tariffs.

    • Such spikes typically coincide with global market slowdowns, commodity-price swings, and volatile capital flows into emerging economies.

    Economic and trade uncertainty are now systemic risks, feeding through to exchange-rate volatility, capital-market stress, and slower investment — effects that inevitably reach African economies through weaker export demand and higher borrowing costs.

    Implications for Kenya and Sub-Saharan Africa

    Channel Global Shock Kenya’s Exposure
    Trade Reduced demand for exports, higher import costs Tea, coffee, and horticultural exports affected; machinery imports costlier
    Finance Tight global liquidity, higher risk premiums Rising external debt service costs
    Policy Transmission US/EU rate hikes Higher domestic lending and T-bill yields
    Investor Confidence Elevated uncertainty Slower FDI inflows and currency volatility

    Kenya’s policy response should focus on:

    • Strengthening regional value chains under AfCFTA.

    • Deepening domestic capital markets to reduce foreign-debt exposure.

    • Expanding green and digital sectors that attract diversified investment.

    Data and Acknowledgment

    Figure Sources: IMF World Economic Outlook (October 2025) — Figures 1.1 & 1.2.
    Data Sources: US International Trade Commission, WTO-IMF Tariff Tracker, Ahir et al. (2022), Caldara et al. (2020), Davis (2016).
    Acknowledgment: International Monetary Fund (IMF) for open global data that informs comparative economic analysis.
    Author: Collins Odhiambo Owino, DatalytIQs Academy

  • Global Economic Outlook and Projections (2025–2026)

    Global Economic Outlook and Projections (2025–2026)

    By Collins Odhiambo Owino
    Author | DatalytIQs Academy
    Data Sources: IMF World Economic Outlook, World Bank Global Prospects Report (2025), and CBK/KNBS datasets.

    The Big Picture

    The global economy is entering 2025 on a modest but cautious trajectory. Despite progress in technology, energy transitions, and inflation stabilization, growth momentum remains fragile — hindered by trade tensions, policy realignments, and monetary tightening across major economies.

    Key Global Highlights

    Indicator 2025 Projection 2026 Projection Note
    Global GDP Growth 3.2% 3.1% Revised downward by 0.5 ppts due to US tariffs and weaker trade flows
    Advanced Economies 1.5% 1.5% Persistent inflation control and higher borrowing costs
    United States 2.0% 1.8% Slower consumer demand amid high interest rates
    Emerging & Developing Economies 4.4% 4.3% Asia remains the growth engine, led by India and Southeast Asia
    Global Output Loss (Cumulative) 0.2% by end-2026 Trade restrictions and supply chain realignments weigh on productivity

    What’s Driving the Slowdown

    1. Trade Tensions and Tariffs:
      The reintroduction of US tariffs and countermeasures by major trading partners has reduced cross-border trade volumes and investment flows.

    2. High Global Interest Rates:
      Central banks — especially the US Federal Reserve and the European Central Bank — maintain tight policies to keep inflation in check, limiting global liquidity.

    3. Shifting Supply Chains:
      A gradual reorganization of production away from China toward emerging economies such as India, Vietnam, and Mexico introduces transitional inefficiencies.

    4. Energy and Climate Transitions:
      Green energy investments continue to expand but face high upfront costs and geopolitical risks tied to critical minerals (lithium, nickel, cobalt).

    Implications for Africa and Kenya

    • Weaker Export Demand: Lower global consumption slows demand for Kenya’s key exports (tea, coffee, flowers, and apparel).

    • Higher Borrowing Costs: Global rate hikes translate into higher domestic lending and debt servicing costs.

    • Currency Pressures: Reduced capital inflows may weaken the Kenyan shilling, reinforcing import-related inflation.

    • Opportunities in Regional Trade: The African Continental Free Trade Area (AfCFTA) offers a buffer, encouraging intra-African trade and localized value chains.

    Kenya’s economic resilience will depend on how effectively it aligns with regional markets, boosts export value addition, and leverages green growth opportunities amid the shifting global order.

    Data and Acknowledgment

    Sources:

    • International Monetary Fund (IMF) World Economic Outlook, October 2025

    • World Bank Global Economic Prospects, 2025–2026

    • Central Bank of Kenya (CBK)

    • Kenya National Bureau of Statistics (KNBS)

    Author: Collins Odhiambo Owino, DatalytIQs Academy

  • Kenya’s Economic Dashboard 2025: Trade, Inflation, and the CBK’s Balancing Act

    By Collins Odhiambo Owino
    Author | DatalytIQs Academy
    Data Sources: Kenya National Bureau of Statistics (KNBS), Central Bank of Kenya (CBK), and the Kenya Data Portal.

    Overview

    Kenya’s economy in late 2025 stands at a delicate crossroads — balancing price stability, trade deficits, and monetary tightening.
    Recent data from the Kenya National Bureau of Statistics (KNBS) and the Central Bank of Kenya (CBK) highlight how inflation, lending rates, and foreign exchange movements interact with the nation’s trade patterns.

    This analysis covers:

    1. Kenya’s trade trends (imports and exports)

    2. Inflation and interest rate movement

    3. CBK’s monetary policy updates (as of October 2025)

    1. Kenya’s Trade Dynamics: Deficit Persists Despite Export Efforts

    Between December 2024 and September 2025:

    • Total Exports averaged KSh 100 billion per month, led by tea, horticulture, and re-exports.

    • Total Imports hovered near KSh 220 billion, mainly industrial inputs, machinery, and fuel.

    • The resulting trade deficit ≈ is KSh 120 billion monthly.

    Insight:
    The persistent deficit weakens the Kenyan shilling, raises import costs, and adds inflationary pressure — directly influencing CBK’s policy stance.

    2. Import Origins: Asia Leads by Far

    Continent Share of Imports (%) Major Trade Partners
    Asia 72.19 China, India, Japan, UAE
    Africa 10.03 South Africa, Egypt, Tanzania
    Europe 9.90 Germany, UK, Netherlands
    America 5.80 USA, Brazil
    Australia & Oceania 2.08 Australia, New Zealand

    Interpretation:
    Asia’s dominance means any shift in Asian manufacturing or shipping costs — particularly in China or India — directly impacts Kenya’s import bill and inflation trends.

    3. Inflation and Interest Rates: The Cost of Stability

    Inflation:

    • Fell sharply from 4.6% (Jun 2024) to 2.7% (Oct 2024), before rebounding to 4.5% (Aug 2025).

    • September 2025 inflation stood at 4.58%, comfortably within the CBK’s target range (2.5%–7.5%).

    Lending Rates:

    • Rose from around 13.2% (2023) to 15.07% (Sep 2025), following CBK’s tightening stance to contain inflation and stabilize the shilling.

    4. CBK Key Rates Snapshot (as of October 30, 2025)

    Indicator Rate Date
    Central Bank Rate (CBR) 9.25% 07 Oct 2025
    CBK Discount Window 10.00% 07 Oct 2025
    91-Day T-Bill 7.81% 03 Nov 2025
    REPO Rate 9.25% 15 Oct 2025
    Inflation Rate 4.58% Sep 2025
    Lending Rate 15.07% Sep 2025
    Savings Rate 3.77% Sep 2025
    Deposit Rate 7.63% Sep 2025

    Interpretation:

    • The high lending rate reflects CBK’s effort to curb inflation without stifling credit to productive sectors.

    • Savings and deposit rates remain low, discouraging household savings and keeping liquidity tight in the market.

    • The T-bill yield signals attractive short-term government borrowing options compared to commercial lending.

    5. How It All Connects

    Economic Driver Effect on the Economy Policy Response
    Trade Deficit Weakens the shilling, increases import costs Raise interest rates to stabilize the currency
    Rising Inflation Reduces purchasing power CBK tightens monetary policy
    High Interest Rates Slows borrowing and investment Stimulate export competitiveness
    Global Fuel Prices Raise import costs and inflation Encourage renewable energy adoption

    Summary Insight:
    Kenya’s 2025 macroeconomic story is one of tightrope balancing — using higher interest rates to fight inflation while managing external shocks from trade deficits and global prices.

    For DatalytIQs Academy Learners

    This combined dataset (KNBS + CBK) can be analyzed through:

    • Python or Excel Dashboards showing trade vs inflation trends.

    • Time-Series Forecasting: Use ARIMA or Prophet to project inflation and lending rates.

    • Correlation Studies: Examine how the shilling exchange rate affects inflation and imports.

    • Policy Simulations: Model effects of interest rate changes on borrowing and investment.

    Data Sources and Acknowledgment

    Primary Sources:

    Acknowledgment:
    Kenya National Bureau of Statistics (KNBS) and the Central Bank of Kenya (CBK) for maintaining open access to macroeconomic indicators that enhance data-driven learning.

    Author: Collins Odhiambo Owino, DatalytIQs Academy

  • Kenya’s Economic Pulse 2025: Trade, Inflation, and Interest Rate Dynamics

    Kenya’s Economic Pulse 2025: Trade, Inflation, and Interest Rate Dynamics

    By Collins Odhiambo Owino
    Author | DatalytIQs Academy
    Data Source: Kenya National Bureau of Statistics (KNBS) – Kenya Data Portal

    Overview

    The Kenyan economy in 2025 reflects a complex web of global trade patterns, price movements, and monetary adjustments.
    Recent data from the Kenya National Bureau of Statistics (KNBS) reveals how imports, exports, inflation, and interest rates interact to shape Kenya’s short-term and medium-term economic trajectory.

    This analysis combines datasets on:

    1. Exports and Imports (Dec 2024–Sep 2025)

    2. Import Sources by Continent

    3. Inflation and Interest Rates (Jun 2024–Aug 2025)

    1. Trade Overview: The Balance of Payments Story

    Kenya’s trade figures reveal a persistent deficit — imports consistently outweigh exports.

    Indicator Average (KSh Billion) Trend
    Exports ≈ 100 Slight increase (Q1–Q2 2025)
    Imports ≈ 220 Stable, slight dip mid-year
    Trade Deficit ≈ 120 Persistent

    Exports:

    • Led by tea, coffee, and horticulture.

    • Re-exports show Kenya’s regional trade role expanding slightly.

    Imports:

    • Dominated by industrial supplies, fuel, and machinery, indicating dependency on foreign inputs for production and energy.

    Insight:
    Despite active export sectors, Kenya’s import needs in energy and manufacturing sustain a wide deficit, exerting downward pressure on the shilling.

    2. Who Kenya Trades With: Asia’s Dominance

    Asia accounts for over 72% of Kenya’s imports, followed by Africa (10%), Europe (9.9%), and America (5.8%).

    Continent Import Share (%) Key Trade Partners
    Asia 72.19 China, India, UAE, Japan
    Africa 10.03 South Africa, Egypt, Tanzania
    Europe 9.90 Germany, UK, Netherlands
    America 5.80 USA, Brazil
    Australia & Oceania 2.08 Australia, New Zealand

    Observation:
    Kenya’s heavy import reliance on Asia emphasizes the region’s influence on local prices — especially through the cost of manufactured goods and fuel.

    3. Inflation and Interest Rates: The Price of Stability

    Inflation:

    • Declined from 4.6% (Jun 2024) to 2.7% (Oct 2024) due to stable food and fuel prices.

    • Rose again to 4.5% (Aug 2025), driven by higher import costs and exchange rate volatility.

    Interest Rates:

    • Lending rates climbed gradually from ~12.8% (2023) to ~13.2% (2025).

    • The Central Bank maintained a tight stance to contain inflation and support the shilling amid external pressures.

    Economic Connection:
    The trade deficit contributes to currency depreciation → higher import costs → inflation, → higher interest rates.
    This chain reflects Kenya’s classic macroeconomic challenge: maintaining growth while stabilizing prices and the exchange rate.

    4. Policy Outlook

    Kenya’s policymakers face a delicate balancing act. To sustain growth while narrowing the trade gap and controlling inflation, the following measures are vital:

    Expand export value chains (agro-processing, tech, manufacturing).
    Support local industries to replace imported intermediate goods.
    Invest in renewable energy to cut fuel import dependence.
    Enhance regional trade under AfCFTA to diversify partners.
    Adopt a data-driven monetary policy that anchors inflation expectations while promoting credit access.

    5. For DatalytIQs Academy Learners

    This combined dataset offers multiple analytical learning paths:

    Skill Application
    Time Series Analysis Forecast inflation, imports, or exports using ARIMA/Prophet models.
    Correlation Analysis Measure links between trade deficit and inflation.
    Data Visualization Build dashboards combining KNBS data (Matplotlib, Plotly, or Power BI).
    Policy Simulation Model the effects of currency depreciation on trade and inflation.

    Data Source and Acknowledgment

    Datasets: External Trade, Inflation, and Interest Rates (2024–2025)
    Source: Kenya Data Portal – KNBS
    Acknowledgment: Kenya National Bureau of Statistics (KNBS) and the African Development Bank for promoting open data access and economic transparency.
    Author: Collins Odhiambo Owino, DatalytIQs Academy

  • Kenya’s Trade Dynamics 2025: Who We Trade With and What It Means for Our Economy

    Kenya’s Trade Dynamics 2025: Who We Trade With and What It Means for Our Economy

    By Collins Odhiambo Owino
    Author | DatalytIQs Academy
    Data Source: Kenya National Bureau of Statistics (KNBS) – Kenya Data Portal

    Overview

    Kenya’s external trade data paints a fascinating picture of an economy deeply integrated with global markets. From industrial imports to tea and coffee exports, the balance of trade reveals both opportunities and vulnerabilities in the country’s economic structure.

    The Kenya National Bureau of Statistics (KNBS) dataset (December 2024 – September 2025) highlights three key trends:

    1. Export performance (domestic and re-exports)

    2. Import composition by category

    3. Import sources by continent

    1. Export Trends: Modest Growth, Limited Diversification

    Kenya’s exports averaged around KSh 100 billion per month during the first three quarters of 2025.

    • Domestic Exports: Continue to dominate, led by tea, coffee, horticulture, and apparel.

    • Re-exports: A steady but smaller share, showing Kenya’s emerging role as a trade hub.

    • Overall Growth: Exports grew slightly from December 2024 to April 2025, before flattening due to subdued global demand.

    Insight: Kenya remains heavily reliant on agricultural exports, leaving the economy exposed to global commodity price shocks.

    2. Import Patterns: Industrial and Energy Dependence

    Monthly imports exceeded KSh 220 billion, with several key categories dominating:

    • Industrial Supplies (Non-Food): The largest share, indicating reliance on foreign raw materials.

    • Fuel and Lubricants: Second-largest component, reflecting energy import dependence.

    • Machinery & Transport Equipment: High due to ongoing infrastructure and manufacturing projects.

    • Consumer Goods: Reflecting growing domestic demand and limited local substitution.

    Result: The average trade deficit stood near KSh 120 billion per month — a structural challenge that affects the exchange rate and foreign reserves.

    3. Import Proportion by Source Continent

    The geographic breakdown of Kenya’s imports highlights a striking dependence on Asia, which supplies 72.19% of total imports.

    Continent Share of Imports (%) Major Source Countries
    Asia 72.19 China, India, Japan, UAE
    Africa 10.03 South Africa, Egypt, Tanzania
    Europe 9.90 Germany, UK, Netherlands
    America 5.80 USA, Brazil
    Australia & Oceania 2.08 Australia, New Zealand

    Observation:
    Asia’s dominance reflects Kenya’s strong import ties with China and India, particularly in machinery, electronics, textiles, and fuel products.

    4. Trade Balance and Economic Outlook

    Indicator Average (KSh Billion) Trend
    Total Exports 100 Slight increase Q1–Q2
    Total Imports 220 Stable, slight rise Q3
    Trade Deficit 120 Persistent imbalance

    Economic implications:

    • The wide trade gap puts pressure on Kenya’s foreign exchange reserves and shilling value.

    • Overreliance on Asia limits supply chain diversification.

    • Export stagnation calls for value addition and regional market expansion.

    5. Policy Recommendations

    To build a sustainable trade structure, Kenya should:
    ✅ Incentivize local manufacturing of industrial inputs.
    ✅ Promote renewable energy projects to reduce fuel imports.
    ✅ Develop export value chains in agriculture and technology.
    ✅ Strengthen intra-African trade through AfCFTA frameworks.

    For DatalytIQs Academy Learners

    This dataset offers hands-on analytical learning opportunities:

    • Compute import–export ratios and visualize the trade deficit trend.

    • Analyze continent-wise trade dependence using pie charts and bar plots.

    • Forecast trade performance using ARIMA or Prophet models in Python.

    • Correlate trade data with GDP, inflation, or currency trends for deeper insights.

    Data Source and Acknowledgment

    Dataset: External Trade (Exports, Imports, and Import Sources, 2024–2025)
    Source: Kenya Data Portal – KNBS External Trade
    Acknowledgment: Kenya National Bureau of Statistics (KNBS) and the African Development Bank for promoting open data and transparency in African economies.
    Author: Collins Odhiambo Owino, DatalytIQs Academy.

  • Kenya’s Trade Balance 2025: Imports, Exports, and the Growing Deficit

    Kenya’s Trade Balance 2025: Imports, Exports, and the Growing Deficit

    By Collins Odhiambo Owino
    Author | DatalytIQs Academy
    Data Source: Kenya National Bureau of Statistics (KNBS) – Kenya Data Portal

    Introduction

    Trade performance is a mirror of a nation’s economic health. In Kenya, imports and exports reveal how production, consumption, and external linkages interact with global markets. The latest data (December 2024 – September 2025) from the Kenya National Bureau of Statistics (KNBS) highlights evolving trends in both exports and imports, as shown below.

    The figures, sourced from the Kenya Data Portal, capture Kenya’s total exports (including domestic and re-exports) and imports by category over ten months.

    Export Trends (Dec 2024 – Sep 2025)

    Kenya’s exports show a relatively stable performance, fluctuating between KSh 80 billion and KSh 110 billion per month.

    Key observations:

    1. Domestic Exports Dominate:
      The blue bars indicate that most of Kenya’s exports come from domestic production, led by tea, horticulture, coffee, and manufactured goods.

    2. Re-exports Increasing Gradually:
      The green segments reveal a slow but steady rise in re-exported goods, possibly reflecting Kenya’s growing role as a logistics hub within East Africa.

    3. Flattening Growth:
      While total exports (red line) grew modestly until April 2025, they plateaued mid-year, signaling limited export diversification and external market challenges.

    Import Trends (Dec 2024 – Sep 2025)

    Kenya’s import bill remains high, averaging over KSh 220 billion monthly.

    Category insights:

    • Industrial Supplies (Non-Food): Largest contributor to total imports, reflecting the country’s reliance on imported raw materials.

    • Fuel and Lubricants: A persistent cost driver linked to global oil prices and exchange rate depreciation.

    • Machinery and Transport Equipment: Continued infrastructure investment keeps these categories strong.

    • Food and Beverages: Vulnerable to agricultural shocks and dependent on imports for staple goods.

    The Trade Deficit Challenge

    Comparing the two charts reveals a structural imbalance:

    • Average Exports: ≈ KSh 100 billion/month

    • Average Imports: ≈ KSh 220 billion/month
      Trade Deficit: Around KSh 120 billion per month

    This persistent trade deficit reflects Kenya’s import-dependent economy, where local industries still rely on external inputs for production, and export diversification remains limited.

    Economic and Policy Insights

    1. Encourage Local Manufacturing:
      Investment in domestic industries that can replace imported goods (e.g., fertilizer, steel, textiles) is critical.

    2. Value Addition for Exports:
      Moving beyond raw agricultural exports to processed goods would raise export value and reduce vulnerability to price shocks.

    3. Regional Trade Opportunities:
      Leveraging AfCFTA and EAC markets can strengthen Kenya’s export base and stimulate intra-African trade.

    4. Energy Transition:
      Reducing reliance on imported fuel through renewable energy projects will stabilize the balance of payments.

    For Learners and Analysts

    For data enthusiasts at DatalytIQs Academy, this dataset provides opportunities to:

    • Practice time-series and trade balance analysis using Pandas or Excel.

    • Compute import-to-export ratios and visualize trends with Matplotlib or Plotly.

    • Build predictive models (e.g., ARIMA or exponential smoothing) for trade forecasting.

    Summary Table (Approximate Monthly Averages, Jan–Sep 2025)

    Indicator Average (KSh Billion) Trend
    Total Exports 100 ↗ Slight Increase (Q1–Q2)
    Total Imports 220 ↘ Mild Dip in May–June
    Trade Deficit 120 ↔ Persistent
    Main Export Tea, Horticulture
    Main Import Fuel, Machinery

    Data Source and Acknowledgment

    Dataset: External Trade Statistics, 2024–2025
    Source: Kenya Data Portal – KNBS External Trade
    Acknowledgment: Kenya National Bureau of Statistics (KNBS) and the African Development Bank for supporting open-access data initiatives in Africa.
    Author: Collins Odhiambo Owino, DatalytIQs Academy.

  • Kenya’s Import Trends: What the 2025 Data Reveals

    Kenya’s Import Trends: What the 2025 Data Reveals

    By Collins Odhiambo Owino
    Author | DatalytIQs Academy
    Data Source: Kenya National Bureau of Statistics (KNBS) – Kenya Data Portal

    Introduction

    Kenya’s economy is highly interconnected with global markets through trade. Imports play a vital role in sustaining the country’s industrial, agricultural, and consumer sectors. Analyzing the KNBS external trade data (2024–2025) provides insights into how global trends, domestic demand, and policy interventions shape Kenya’s import behavior.

    The figure below, extracted from the Kenya Data Portal, illustrates monthly import patterns by category from December 2024 to September 2025.

    Key Observations

    1. Stable but High Import Levels:
      The total import bill fluctuates around KSh 200–250 billion per month, showing resilience despite global inflationary pressures and exchange rate fluctuations.

    2. Dominance of Industrial Supplies:
      Industrial supplies (non-food) form the largest component of imports, highlighting Kenya’s heavy reliance on foreign raw materials and intermediate goods for manufacturing.

    3. Fuel and Lubricants – A Persistent Burden:
      The magenta segment shows that petroleum products continue to absorb a significant share of the import bill. Volatile oil prices and currency depreciation amplify this cost burden.

    4. Machinery and Transport Equipment Rising:
      Imports of machinery and transport equipment remain substantial, reflecting ongoing infrastructure and industrialization projects — from energy plants to construction machinery.

    5. Food and Beverages:
      Though relatively smaller, food imports underscore Kenya’s vulnerability to agricultural shocks such as droughts, floods, and global grain supply disruptions.

    Economic Implications

    • Exchange Rate Pressure:
      Sustained imports weigh on Kenya’s current account balance, putting pressure on the Kenyan shilling against major currencies.

    • Industrial Dependence:
      The high share of industrial supplies signals limited domestic production capacity for essential inputs — an area ripe for local investment and innovation.

    • Fuel Price Sensitivity:
      Any global oil price spikes directly influence Kenya’s import costs, inflation, and transport expenses.

    Policy Reflections

    To manage external vulnerability and foster economic stability, Kenya could consider:

    • Expanding local manufacturing of intermediate goods.

    • Diversifying energy sources to reduce fuel import dependence.

    • Promoting export-oriented industries to offset import bills.

    • Leveraging AfCFTA trade frameworks to substitute imports with regional products.

    Insight for Learners

    For DatalytIQs Academy students and enthusiasts, this dataset provides an excellent opportunity to:

    • Practice time-series visualization using Python (Matplotlib/Seaborn).

    • Apply trend and seasonality analysis using ARIMA models.

    • Explore import–export correlations with GDP growth or inflation.

    Data Source and Acknowledgment

    Dataset: External Trade Data (Imports by Category, 2024–2025)
    Source: Kenya Data Portal – KNBS External Trade
    Acknowledgment: Kenya National Bureau of Statistics (KNBS) and the African Development Bank for their data transparency and continuous contribution to open data in Africa.
    Author: Collins Odhiambo Owino, DatalytIQs Academy.


  • The Sleep–Stress Connection: What Your Digital Habits Reveal

    The Sleep–Stress Connection: What Your Digital Habits Reveal

    By Collins Odhiambo Owino — DatalytIQs Academy
    Data Source: Kaggle (Digital Wellbeing Dataset, 2025)

    Introduction

    In an age where phones glow longer than sunsets, our minds rarely switch off.
    Digital engagement has blurred the boundary between rest and routine — influencing how well we sleep and how stressed we feel.

    At DatalytIQs Academy, we examined 500 respondents from a Kaggle Digital Wellbeing dataset (2025) to understand how sleep quality and stress levels intertwine in today’s always-connected world.

    Sleep and Stress — Averages with Standard Deviation

    🖼️ Figure 4: Sleep & Stress Averages with SD
    (Image Source: 4_sleep_stress_bar_sd.png)

    Metric Mean Standard Deviation (±) Interpretation
    Sleep Quality (1–10) 6.30 1.53 Moderate sleep satisfaction
    Stress Level (1–10) 6.62 1.55 Slightly above neutral stress

    What the Data Tells Us

    The results paint a relatable picture of modern life:

    • Most respondents report average sleep quality, suggesting that few enjoy fully restorative rest.

    • Stress levels slightly exceed sleep ratings, hinting at mild digital tension — likely from notifications, multitasking, or long screen hours.

    • The near-equal standard deviations (≈1.5) show that sleep and stress vary similarly across individuals, meaning lifestyle habits drive much of the difference.

    Further analysis revealed that individuals with 7+ hours of sleep and less than 5 hours of screen time scored higher on happiness and focus metrics.

    The Digital Wellbeing Insight

    Sleep and stress are two sides of the same behavioral coin.
    Our analytics show:

    • More time online → shorter, poorer-quality sleep.

    • Poor sleep → higher self-reported stress.

    • Sustained high stress → reduced exercise frequency and happiness scores.

    This reinforces the feedback loop seen in digital wellbeing research — where over-stimulation and fatigue perpetuate one another.

    Methodology

    • Dataset: Digital Wellbeing & Social Media Usage — Kaggle (2025)

    • Sample Size: 500 respondents

    • Metrics Used: Sleep_Quality(1-10), Stress_Level(1-10)

    • Tools: Python (pandas, matplotlib)

    • Visualization: Bar chart with error bars (mean ± standard deviation)

    • Author: Collins Odhiambo Owino

    • Institution: DatalytIQs Academy — Mathematics, Economics & Finance Online School

    About DatalytIQs Academy

    DatalytIQs Academy empowers learners to apply analytical reasoning to real-world challenges — from economics and finance to digital wellbeing and behavioral data.
    Our projects show how quantitative methods illuminate the human side of numbers.

    Visit: www.datalytiqs.academy
    Email: info@datalytiqs.academy

    Acknowledgement

    We acknowledge:

    • Kaggle, for providing the open dataset used in this analysis.

    • DatalytIQs Academy, for fostering interdisciplinary research and analytics.

    • Collins Odhiambo Owino, for conducting and authoring the visualization and insights.

    Conclusion

    The data suggests that digital well-being starts with rest.
    Monitoring screen time, practicing tech-free wind-downs, and prioritizing consistent sleep can significantly reduce stress and boost overall life satisfaction.

    In our next post:
    “The Happiness Equation — How Exercise, Sleep, and Screen Time Interact in Modern Life.”

  • The Social Media Landscape: Who Rules the Digital World in 2025?

    The Social Media Landscape: Who Rules the Digital World in 2025?

    By Collins Odhiambo Owino — DatalytIQs Academy
    Data Source: Kaggle (Digital Wellbeing Dataset, 2025)

    Introduction

    Social media isn’t just a pastime — it’s a global lifestyle.
    From networking and creativity to news and entertainment, digital platforms define how we connect and express ourselves.

    At DatalytIQs Academy, our analysis of a Digital Wellbeing dataset (Kaggle, 2025) reveals fascinating insights into platform popularity and the balance between online engagement and wellbeing.

    Most Popular Platforms Among Respondents

    Figure 5: Most Used Social Media Platforms (Horizontal Bar Chart)
    (Image Source: 5_platform_usage_horizontal_bar.png)

    The visualization above shows the number of respondents using each major platform among 500 participants.

    Platform Number of Users Share (%)
    TikTok 95 19%
    X (Twitter) 88 17.6%
    LinkedIn 87 17.4%
    Facebook 81 16.2%
    YouTube 75 15%
    Instagram 74 14.8%

    Interpreting the Trends

    TikTok leads the pack — reflecting the rise of short-form content, creative storytelling, and algorithmic engagement.
    Meanwhile, Twitter (now X) and LinkedIn remain influential for professionals and opinion leaders.

    Key observations:

    • TikTok’s dominance shows how visual, fast-paced interaction appeals to younger audiences.

    • LinkedIn’s strong showing signals growing interest in professional learning and career branding.

    • Facebook and YouTube, once dominant, now hold steady middle-ground positions.

    • Instagram continues as a versatile hub for lifestyle, business, and influencer content.

    These findings mirror broader global analytics from DataReportal (2025), where TikTok also tops engagement metrics in most regions.

    What This Means for Digital Wellbeing

    Each platform engages users differently — but with that comes varying psychological and time-use implications.
    Our ongoing research at DatalytIQs Academy links platform usage patterns with:

    • Screen time duration

    • Stress levels

    • Sleep quality

    • Happiness index

    Preliminary insights suggest that diverse platform use (rather than overreliance on one) correlates with higher well-being and lower digital fatigue.

    Methodology

    • Dataset: Digital Wellbeing & Social Media Usage — Kaggle (2025)

    • Sample Size: 500 respondents

    • Visualization Tool: Python (Matplotlib)

    • Analysis Type: Frequency distribution (top platforms by user count)

    • Author: Collins Odhiambo Owino

    • Institution: DatalytIQs Academy — Mathematics, Economics & Finance Online School

    About DatalytIQs Academy

    DatalytIQs Academy combines data analytics with real-world impact.
    Our courses empower learners to master data science, economics, and digital research — while exploring how technology shapes human behavior.

    Visit: www.datalytiqs.academy

    Email: info@datalytiqs.academy

    Acknowledgement

    We acknowledge:

    • Kaggle, for open-access datasets powering global research.

    • DatalytIQs Academy, for fostering data education and innovation.

    • Collins Odhiambo Owino, for leading this digital behavior analysis.

    Conclusion

    TikTok’s leadership and LinkedIn’s surprising rise highlight a digital world where creativity meets productivity.
    But beyond trends and clicks, the real insight is balance — knowing when to scroll, when to learn, and when to log off.

    Stay tuned for our next post in this series:
    “Stress, Sleep, and the Happiness Paradox: What Social Media Doesn’t Show You.”

  • How Much Screen Time Is Too Much? A Data-Driven Look at Digital Habits

    How Much Screen Time Is Too Much? A Data-Driven Look at Digital Habits

    By Collins Odhiambo Owino — DatalytIQs Academy
    Data Source: Kaggle (Digital Wellbeing Dataset, 2025)

    Introduction

    From sunrise to bedtime, screens dominate our waking hours — phones, laptops, and tablets connect us to work, learning, and leisure.
    But how much screen time is healthy? And what does the data say about how people manage it?

    At DatalytIQs Academy, we analyzed a Digital Wellbeing dataset from Kaggle featuring 500 global respondents to explore daily screen time patterns and what they reveal about our digital lifestyle.

    The Data Snapshot

    🖼️ Figure 3: Daily Screen Time — Summary (Boxplot)
    (Image Source: 3_screen_time_boxplot.png)

    The visualization above summarizes respondents’ daily screen time (in hours) using a boxplot.

    Metric Observation
    Median screen time ~5.5 hours/day
    Interquartile range (IQR) 4 – 7 hours
    Outliers Some individuals exceed 10 hours/day, showing intense digital engagement
    Minimum reported time ~1 hour/day

    Interpreting the Pattern

    The data paints a revealing picture:

    • The average user spends 5–6 hours online daily — roughly a third of waking time.

    • About 25% of users exceed 7 hours/day, placing them in the “heavy-use” group.

    • A few digital outliers log over 10 hours/day, possibly content creators, streamers, or remote professionals.

    This aligns with global digital reports from Statista (2024), showing an average worldwide screen time of 6.4 hours/day.

    The Wellbeing Connection

    Screen time correlates closely with well-being metrics such as sleep, stress, and happiness.
    Preliminary findings from this dataset suggest:

    • Those with moderate screen time (3–6 hours) report higher sleep quality and lower stress levels.

    • Heavy users tend to experience digital fatigue, eye strain, and reduced offline social time.

    This insight underscores a key principle in digital wellness:

    Balance is better than restriction.
    The goal is mindful use, not elimination of technology.

    Methodology

    • Dataset: Digital Wellbeing & Social Media Usage — Kaggle (2025)

    • Sample Size: 500 respondents

    • Variables Used: Daily_Screen_Time(hrs), Sleep_Quality(1-10), Stress_Level(1-10)

    • Tools: Python (pandas, matplotlib)

    • Visualization: Boxplot + scatter overlay for distribution context

    • Author: Collins Odhiambo Owino

    • Institution: DatalytIQs Academy — Mathematics, Economics & Finance Online School

    DatalytIQs Insight

    At DatalytIQs Academy, we encourage learners to analyze everyday life through data.
    This screen-time study illustrates how descriptive statistics and visualization help uncover behavioral insights that matter for individuals, educators, and digital health advocates.

    Visit: www.datalytiqs.academy
    Email: info@datalytiqs.academy

    Acknowledgement

    We acknowledge:

    • Kaggle, for open data that empowers global learning.

    • DatalytIQs Academy, for fostering data-driven wellbeing analysis.

    • Collins Odhiambo Owino, lead author, educator, and analyst.

    Conclusion

    With screen time becoming an integral part of modern life, this analysis reinforces the need for awareness and balance.
    In the next article of this series, we’ll explore how sleep quality and stress interact — asking the question:

    “Can digital detox days really improve wellbeing?”